Applixure Analytics
Always Know Which Devices to Extend, Fix, or Replace
Objective insight into computer health, so IT teams can stop replacing healthy computers and act with confidence today.
Trusted by IT Teams Globally


Outcomes for IT (and finance)
Turn actionable insights into measurable outcomes.
-
Optimise for healthy devices
-
More accurate & predictable hardware & software budgets
-
Clear justification for every decision
-
Fewer premature replacements
-
Less reactive IT work
2-3+ years
average lifespan extension
Up to 80%
fewer premature replacements
100%
data-driven decisions
Key Capabilities
How Applixure Analytics Helps Optimise Computer Fleets
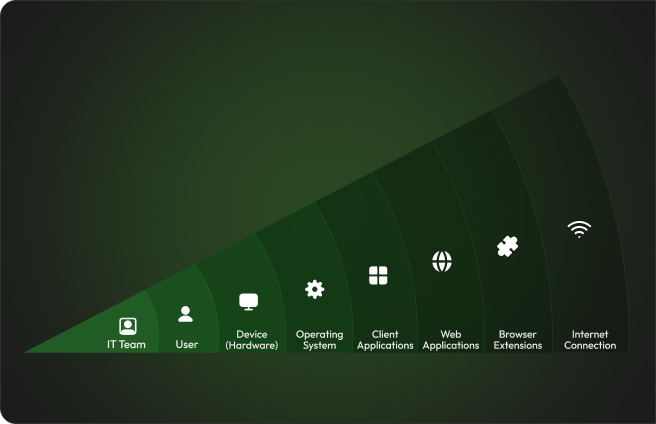
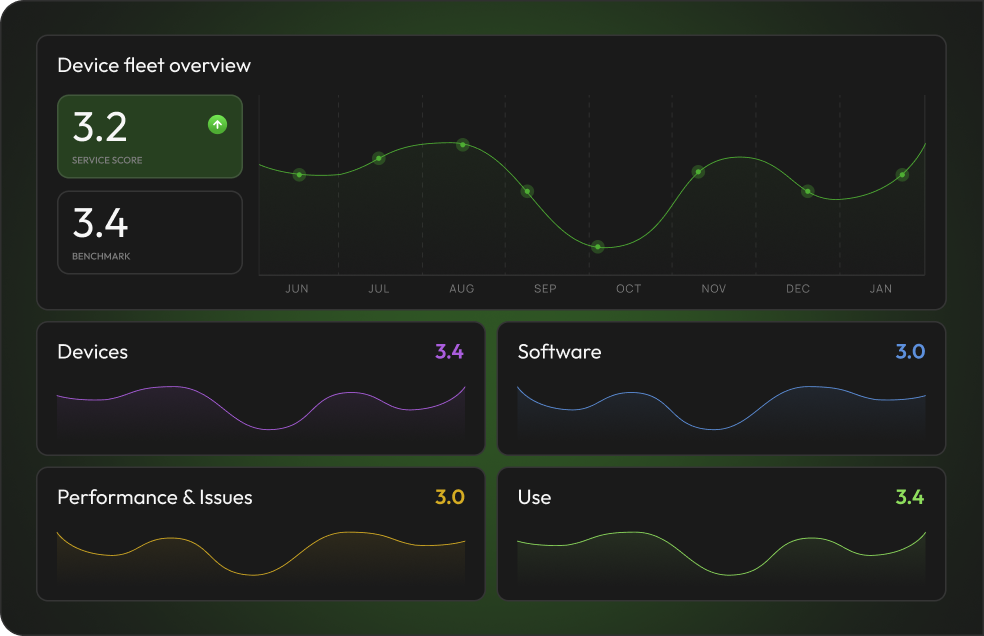
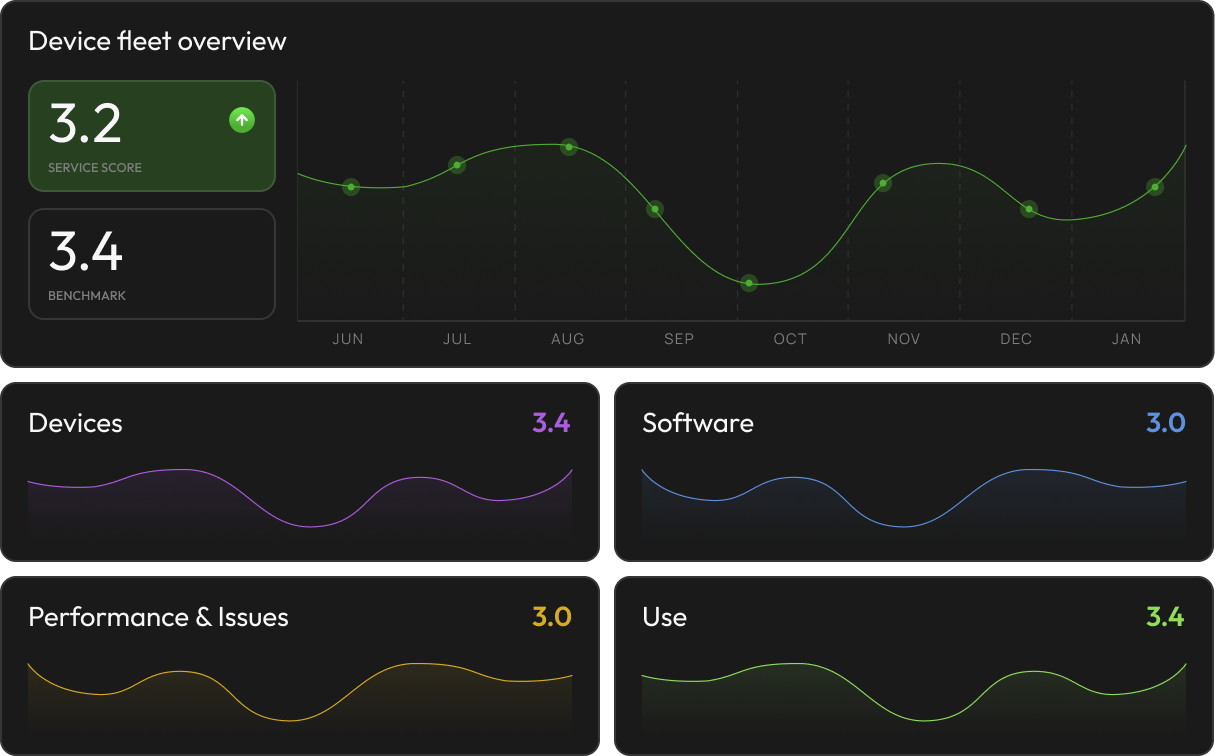
Full Visibility Across the Entire Device Experience
Understand performance and issues across every layer.
- Unified visibility across user, device, applications, and connectivity
- Identify root causes faster with structured, multi-layer insights
- Turn data into clear actions
Only Available for Annual Plans
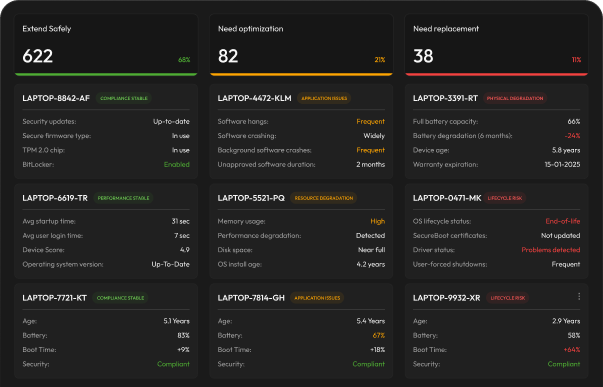
Lifespan Analysis Intelligence
Report showing which devices to extend, fix, or replace, based on computer health.
- Automatic classification into Extend, Fix, or Replace.
- Based on real device condition, not age or assumptions.
- Clear, actionable decisions across the entire fleet.
Continuous (Fleet) Degradation Tracking
Spot devices getting worse before replacement is needed.
- Tracks performance, stability, and health over time.
- Highlights devices that are degrading, not just broken.
- Enables early fixes instead of late replacements.
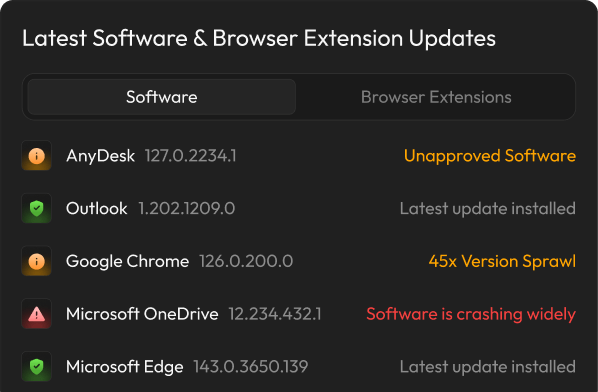
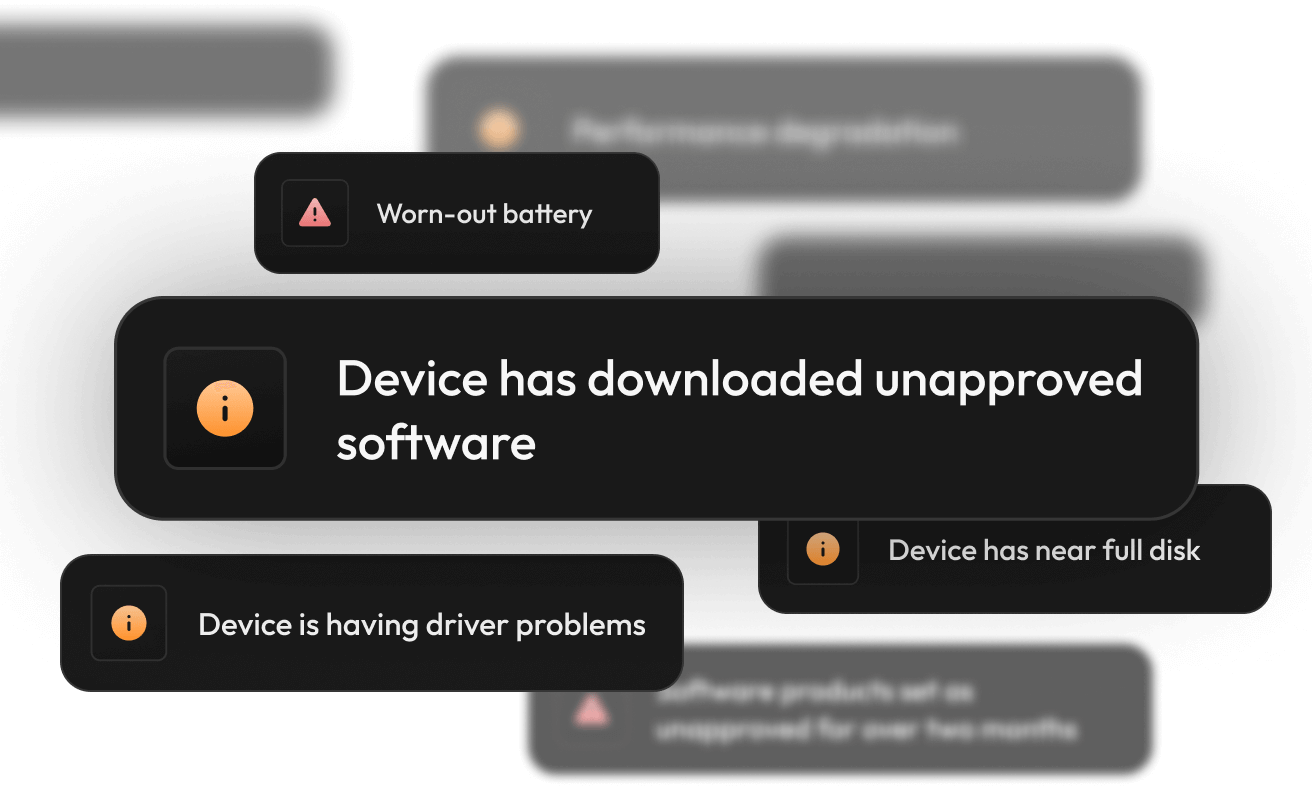
Software Sprawl & Version Control
Prevent software from shortening device lifespan.
- Identify unapproved or outdated software versions.
- Track software usage, stability, and impact.
- Reduce performance issues caused by software sprawl.
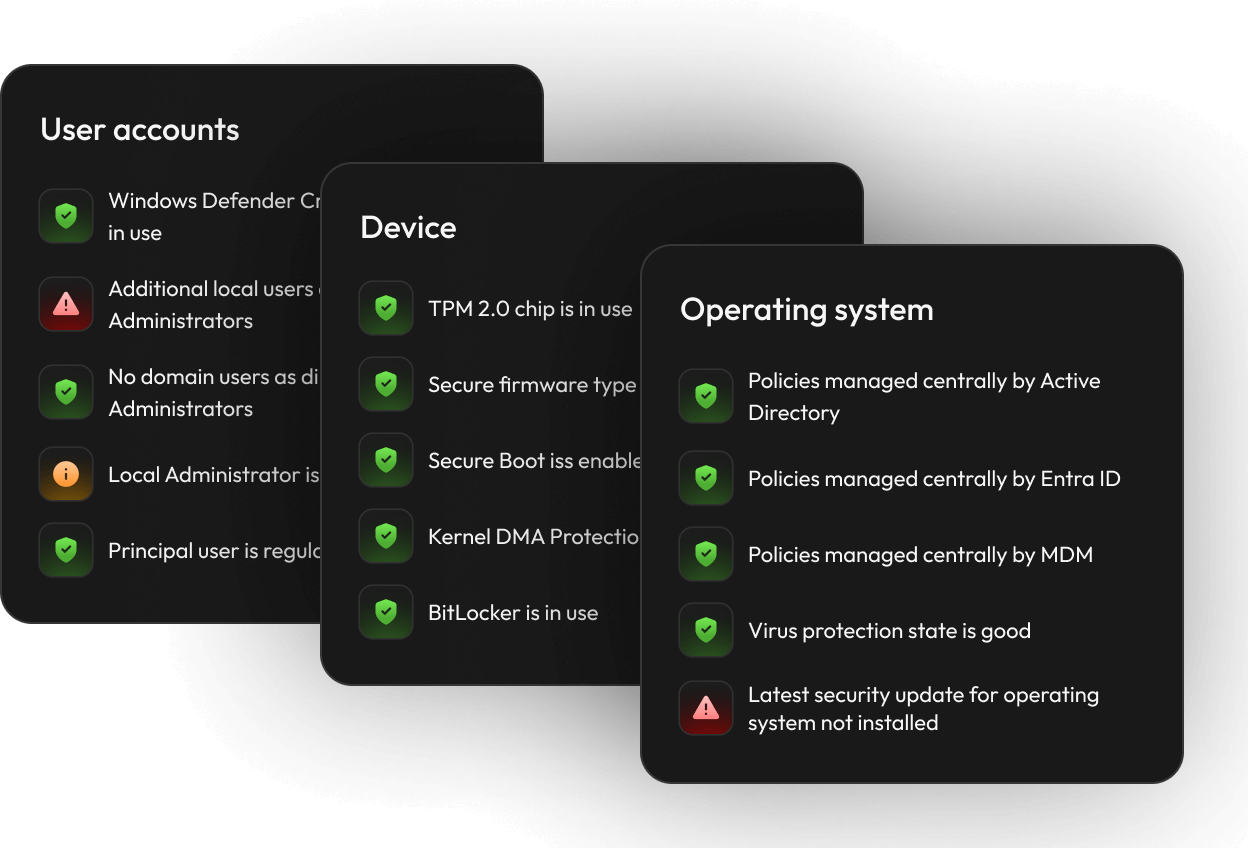
Security Readiness Validation
Extend devices safely, not blindly.
- Verifies encryption, OS updates, and security configuration.
- Ensures only compliant devices are extended.
- Reduces risk while extending device lifespan.
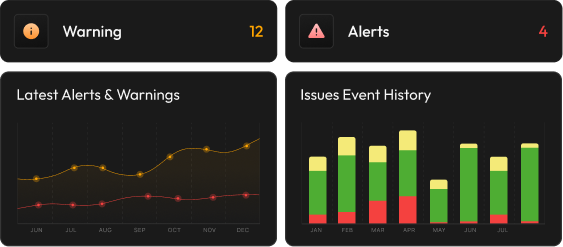
Performance & Stability Detection
Identify trends early and prevent a wide spread issue.
- Detects performance degradation and instability.
- Flags issue trends like crashes, slow startup, and high resource usage.
- Helps prevent fixable devices from becoming end-of-life.
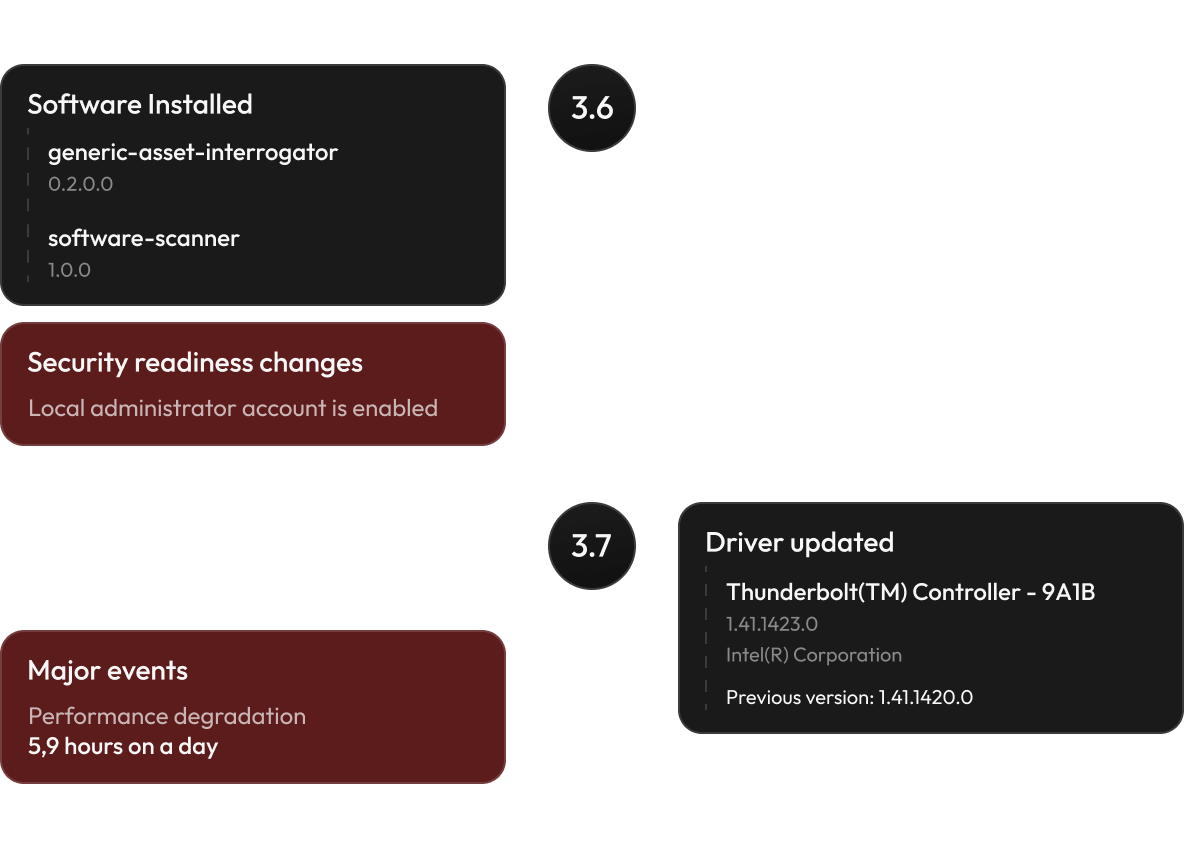
Change History & Root Cause Analysis
Understand what changed before problems started.
- Track configuration and software changes over time.
- See events that preceded performance degradation.
- Fix root causes instead of replacing devices
Device-Level Drill-Down
See exactly why a device is flagged.
- Click from fleet overview into any individual device.
- View alerts, condition signals, and contributing factors.
- Make confident, defensible lifecycle decisions.
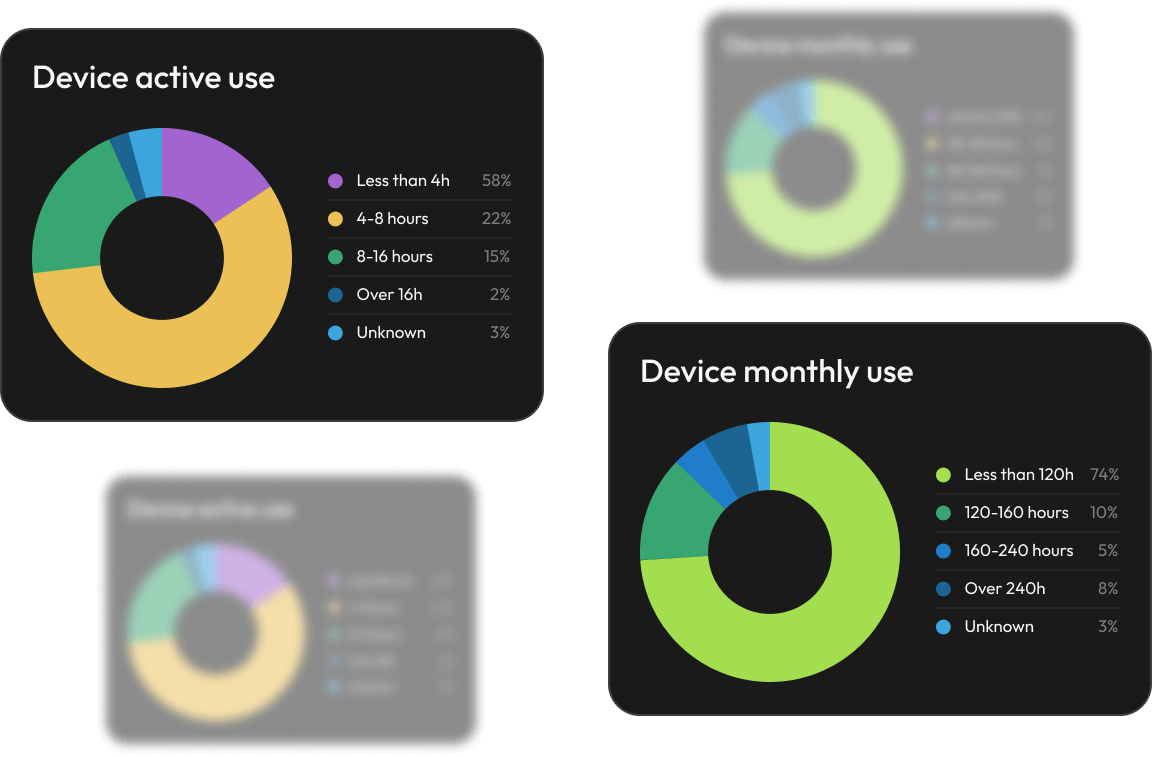
Usage & Utilization Context
Prioritise action based on real impact.
- See how often and how intensively devices are used.
- Distinguish critical work devices from low-impact ones.
- Focus fixes and replacements where productivity is affected.
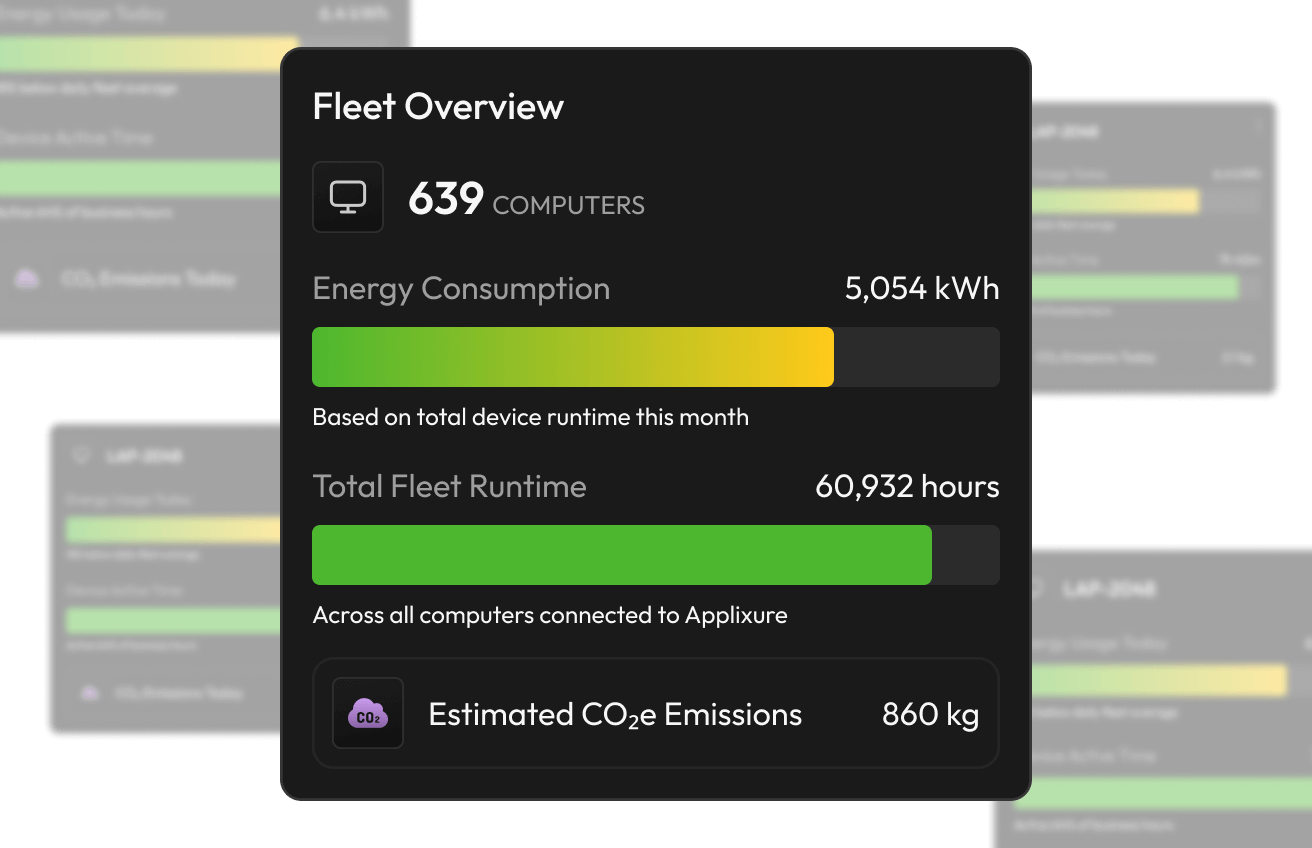
Energy & Sustainability Insight
Extend devices responsibly and reduce waste.
- Track energy usage and efficiency at device level.
- Reduce unnecessary replacements and e-waste.
- Support sustainability and ESG reporting.
Plug & Play
Get Results in 1 day
Create account & deploy lightweight pre-configured agents
Account setup and agent deployment takes about 15 minutes across your environment.
Data starts flowing automatically
Static device information appears immediately. Performance signals, crashes, and experience data are collected continuously as devices are used.
Start optimizing based on real data
Start improving device performance and replacement decisions based on real usage and device health signals.
-

No complicated setup
-
No complex configuration
-
No maintenance
Real Results: How PMC Gained Control of Their Fleet
From reactive firefighting to proactive fleet management
24%
Fewer laptop failures
36%
Fewer incidents
25%
Less firefighting
+1yr
Added device lifespan
"We can catch machines before they fail and fix what’s needed instead of replacing the whole device. It’s helped us make much better use of our existing hardware."
Senior IT Lead at PMC
Plug & Play Solution
Get The Most Out Of Your Existing Computer Fleet
Applixure Analytics
Shows what needs attention right now.
Applixure Workflow
Turns insight into immediate action.
Applixure Feedback
Validates real user impact.
Why Companies Trust Applixure
Applixure prioritizes data security and compliance, ensuring your organization's information is protected with industry-leading measures:
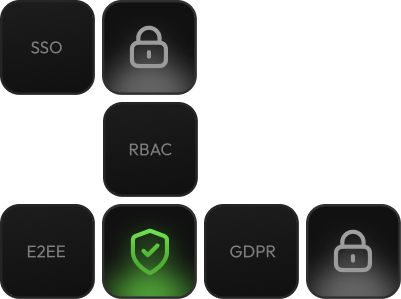
- ISO/IEC 27001 Certified
- Single Sign-On (SSO) Support (Entra / Okta)
- End-to-End Data Encryption
- Secure Cloud Hosting
- Regular Security Audits and Penetration Testing
- GDPR and Privacy Compliance
Trusted by IT Teams Globally


No Chatbots or Outsourced Support
Our support team isn’t made up of chatbots or outsourced help. You’ll work directly with the experts who built and continue to develop our solutions, ensuring you get knowledgeable, hands-on support every step of the way.
Book a demo